Mapping open space and catchments
Every site on a map, every home in a catchment: how GIS turned open space audits into planning evidence.
The Common Ground editorial deskPublished 5 min read
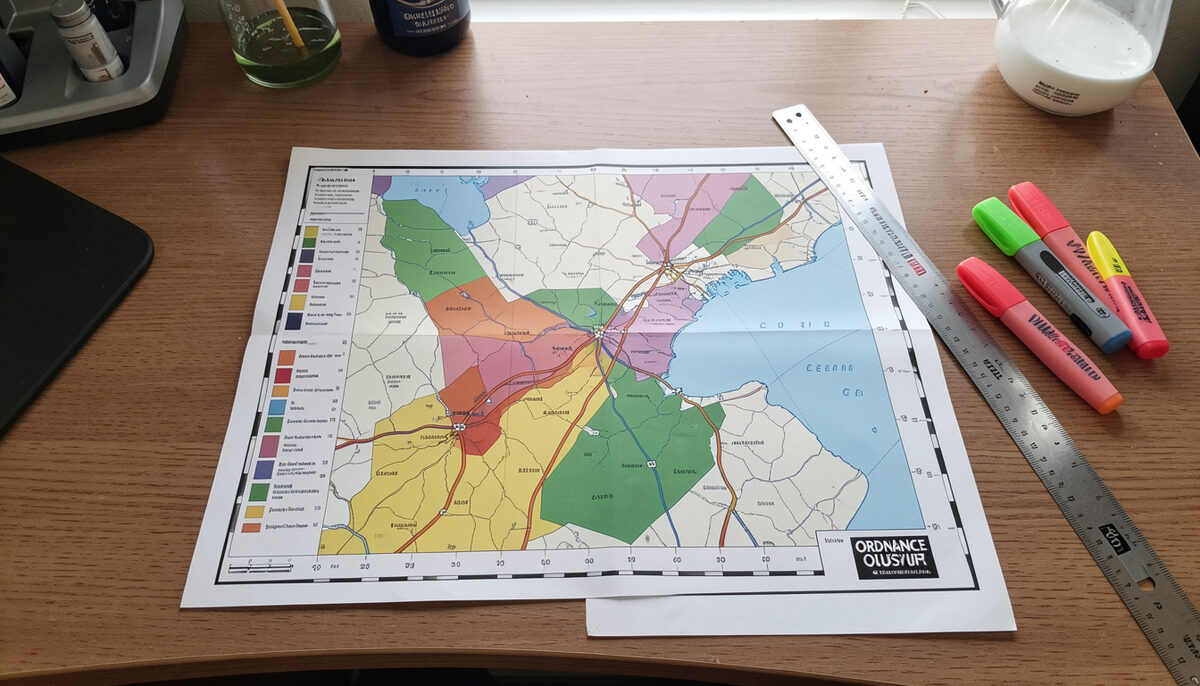
Mapping sits at the centre of any serious open space study. An audit can produce careful descriptions of a park, a recreation ground or an area of informal green space, but until those descriptions are attached to locations and analysed spatially, they remain a list. Geographic information systems (GIS) turn the list into evidence: where provision is, how good it is, who can reach it, and where the gaps fall. This article explains the main mapping techniques used in open space studies, and the outputs a local plan can legitimately cite.
The approach described here reflects the working methods developed by planning and leisure consultancies operating in Hertfordshire and the wider south-east of England, including Ashley Godfrey Associates, a Ware-based practice that carried out open space and play assessments for local authorities over many years.
Layering the sites
The first task is to build a base layer of open space sites. Each site is drawn as a polygon in GIS, usually digitised against Ordnance Survey mapping, and classified by typology: parks and gardens, natural and semi-natural green space, amenity green space, provision for children and young people, allotments, civic spaces and so on. The typology follows the framework established by national guidance on open space assessments, described further in from PPG17 to the NPPF.
Classification matters more than it first appears. A playing field and a country park may sit side by side on the map, but they serve different needs and are assessed against different standards. Once each polygon carries its typology, the map becomes a structured inventory rather than a collection of green shapes. The Ordnnance Survey itself maintains a national greenspace layer to support exactly this kind of work, described at the OS greenspace pages.
Accessibility catchments
The second step is to ask who can reach each site. Standards inherited from bodies such as Fields in Trust, and from earlier national guidance, set distance thresholds for each type of provision: a walk of a few hundred metres to a local area of play, a longer walk to a neighbourhood park, a drive to a major destination. These thresholds are applied in GIS as catchments drawn around each site.
Catchments can be drawn as simple straight-line buffers, but the more defensible method applies the threshold across the street network, following the paths people actually walk. Either way, the result is a map showing the area served by each site. Overlaying population data on these catchments allows the study to estimate how many households fall inside or outside the walking distance for each typology.
Deficiency mapping
Deficiency mapping brings the layers together. Once catchments are drawn for all sites of a given type, the areas not covered by any catchment stand out clearly. These are the deficiency areas: places where residents cannot reach, say, a park of the appropriate size within the adopted walking distance.
Read together with quantity standards, deficiency maps give a local authority two complementary tests. The quantity test asks whether there is enough open space per thousand head of population. The accessibility test asks whether that space is actually within reach of the people it is meant to serve. An area can pass the first and fail the second, where provision is concentrated on one side of a town or cut off by a main road, a railway or a river. This is precisely the kind of finding that a map communicates more directly than any table.
Linking audit data to polygons
Distance analysis alone says nothing about quality. The strength of the GIS approach is that each site polygon can be linked to the records from a field audit, so that the map carries the full assessment for every site. How the audits themselves are carried out is covered in surveys and audits of local provision.
- Quality scores. Site visits record condition, maintenance, safety, lighting, seating, toilets and other attributes, scored consistently so that sites can be compared across the authority.
- Value scores. A separate judgement records how much a site matters: its ecological, heritage, amenity or community value, following the principle that high value should be protected even where quality is poor.
- Site attributes. Size, typology, facilities present, and management responsibility are attached to each polygon, so the map can be queried by any of these fields.
Once quality and value are held against each polygon, the mapping can identify sites that fall below the quality threshold within a catchment, and flag where a deficiency in effective provision exists even though a site exists on paper. A play area that scores poorly, for example, does not fully serve its catchment, a point developed in how children's play provision is assessed.
Outputs a local plan can cite
The end products of the mapping work are designed to be policy-ready. A typical study delivers:
- a digital site register and mapped inventory of all open space by typology, with audit scores attached;
- accessibility maps for each typology showing catchments and deficiency areas against adopted distance thresholds;
- analysis of existing provision against quantity, quality and accessibility standards, at settlement and ward level;
- recommendations for new provision, enhancements or protection, each traceable to a mapped finding.
For a local plan, the value lies in traceability. A policy protecting open space, or a requirement that new development contributes to provision, is far harder to challenge at examination when the evidence base shows precisely where deficiency exists and how the standard was derived. The same outputs feed later work: playing pitch strategies, play strategies, and work on heritage mapping in open space planning all build on the same site register.
Mapping, done properly, is not decoration for a report. It is the analytical spine of the study, joining the audit, the standards and the plan into a single chain of evidence.